Contents
- this matlab code provides some techniques and methods to view and identify organs of a CT image
- plot histogram of the image
- perform the color map of a CT image
- HSV space
- filtering demo on the CT data
- average filter by hand
- high-pass by hand
- average filter
- gaussian filter
- unsharp mask
- laplacian
- laplacian of gaussian
- threshold
- prewitt edge filter
- sobel edge filter
- standard deviation edge filter
- skew filter
- kurtosis filter
this matlab code provides some techniques and methods to view and identify organs of a CT image
The first method is to use histogram to segment the second method is to use color a CT image third method is filter.
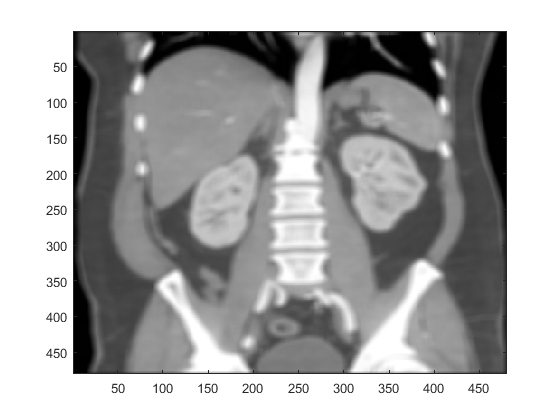
% read a CT image
I=imread('./Abdominal wall normal anat (8).png');
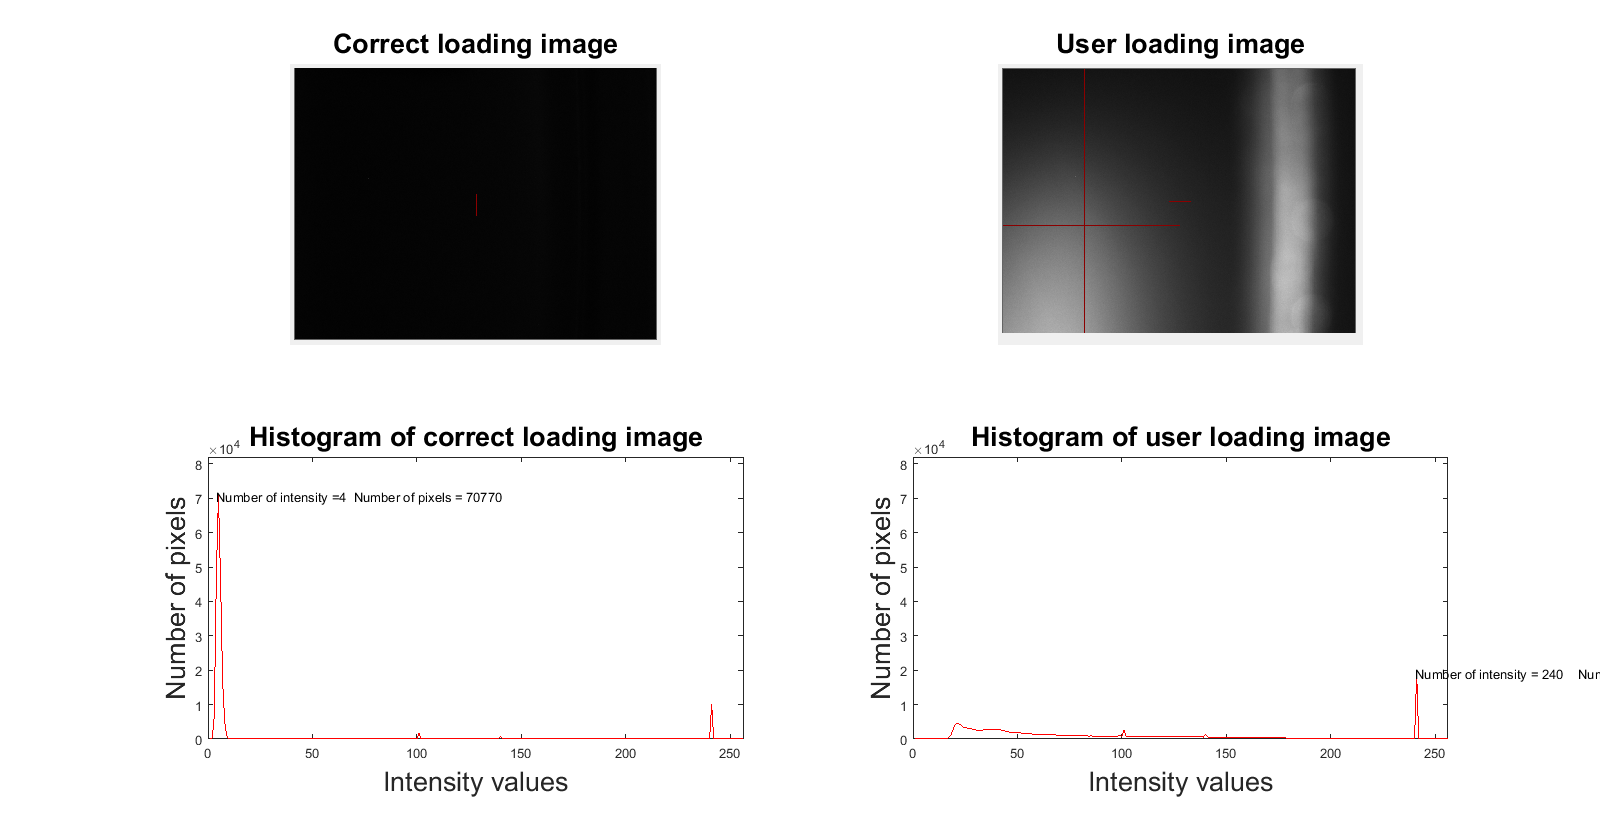
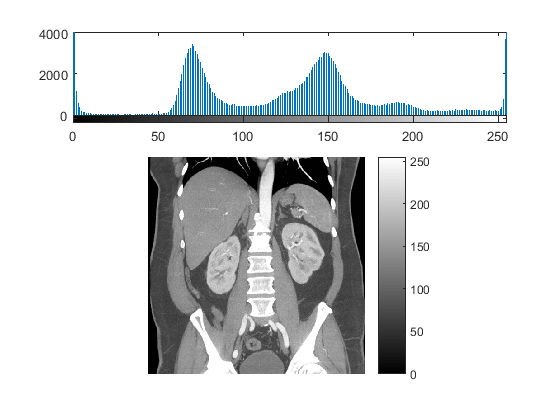
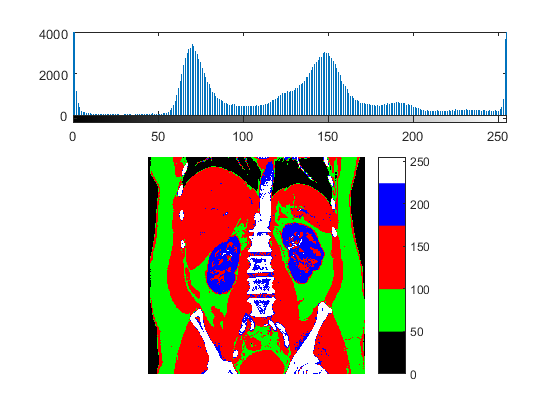
plot histogram of the image
subplot(311); % plot to ensure a correct image is loaded.
imhist(I)

subplot(3,1,2:3);
imshow(I);
colorbar
perform the color map of a CT image
colormap(jet);
caxis
caxis([0,255]);
ans =

     0   255
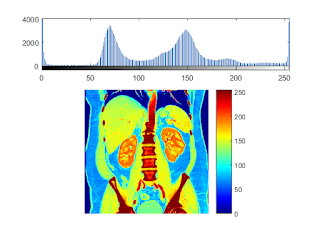

colormap( [repmat([0,0,0],[50,1]); ... % 0-50
          repmat([0,1,0],[50,1]);...  % 51-100
          repmat([1,0,0],[75,1]);...  % 100-175
          repmat([0,0,1],[50,1]);...  % 176-225
          repmat([1,1,1],[56-25,1])]);
colorbar
HSV space
convert to single-precision floating point
I = single(I);
[ny,nx] = size(I);
Ihsv = zeros(ny,nx,3);
Ihsv(:,:,2) = 0.5;
Ihsv(:,:,3) = I/max(I(:));

% add color
th1 = 50;
th2 = 100;
th3 = 170;
Ihsv(:,:,1) = Ihsv(:,:,1) + (I<th1) * 0;
Ihsv(:,:,1) = Ihsv(:,:,1) + (I>th1 & I<th2) * 0.1;
Ihsv(:,:,1) = Ihsv(:,:,1) + (I>th2 & I<th3) * 0.2;
Ihsv(:,:,1) = Ihsv(:,:,1) + (I>th3 & I<225) * 0.5;
Ihsv(:,:,1) = Ihsv(:,:,1) + (I>225) * 0.8;

imshow(hsv2rgb(Ihsv));

filtering demo on the CT data
clf;
imagesc(I);colormap(gray);
title('unfiltered');

average filter by hand
n = 5;
b = ones(n,n)/ (n*n);
I2 = conv2(I,b,'same');
imagesc(I2);

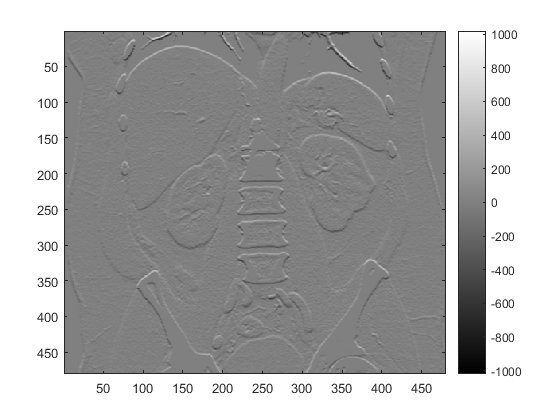
high-pass by hand
b = [-1, -1, -1; -1, 7.9866, -1; -1, -1, -1];
I2 = conv2(I,b,'same');
imagesc(I2);
colorbar
mean(I2(:))
caxis([-200,300])
ans =

   -0.0026

average filter
I=single(I);
b = fspecial('average',[9,9]);
I2 = conv2(I,b,'same');
imagesc(I2);
gaussian filter
note: pick filter size appropriately imagausfilt avoids this problem
I=single(I);
b = fspecial('gaussian',32,2);
I2 = conv2(I,b,'same');
imagesc(I2);

unsharp mask
b = fspecial('unsharp');
subplot(221);
imagesc(b);
colorbar;
subplot(222);
imagesc(I);
subplot(224);
I2 = conv2(I,b,'same');
imagesc(I2);

laplacian
clf
b = fspecial('laplacian');
I2 = conv2(I,b,'same');
imagesc(I2);


laplacian of gaussian
b = fspecial('log');
I2 = conv2(I,b,'same');
imagesc(I2);
colorbar


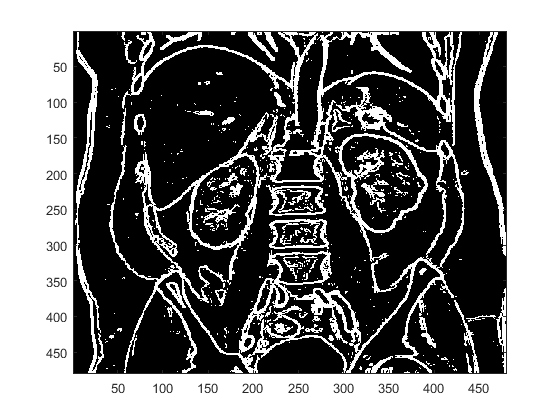
threshold
imagesc(abs(I2)>60);


prewitt edge filter
b = fspecial('prewitt');
I2 = conv2(I,b.','same');
imagesc(abs(I2));
colorbar
caxis([0,300])


imagesc(abs(I2)>150)


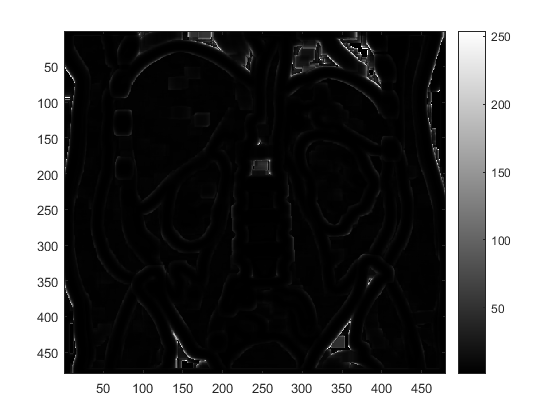
sobel edge filter
b = fspecial('sobel');
I2 = conv2(I,b,'same');
imagesc(I2);
colorbar

imagesc(abs(I2)>200)


standard deviation edge filter
I2 = nlfilter(I, [3,3], 'std2');
imagesc(I2);
colorbar;


imagesc(I2>10);


skew filter
f = @(X) skewness(X(:));
I2 = nlfilter(I, [3,3], f);
imagesc(I2);
colorbar;


kurtosis filter
f = @(X) kurtosis(X(:));
I2 = nlfilter(I, [16,16], f);
imagesc(I2);
colorbar;